# Audit logs
# Overview
The Signicat Audit logs service provides you with documented evidence of the sequence of activities that have affected a system, from a security and quality perspective.
The activities are represented as events, and are shown for a selected account. The service allows you to query, view and filter events.
# Get started with the audit logs service
You can query and view audit logs for the selected account in the Signicat Dashboard. To do this:
- Log in to the Signicat Dashboard (opens new window).
- In the top navigation bar, use the dropdown menu next to your organisation name to select the account that you want to make changes to.
- Open the left-side menu, then click Audit logs.
- You are now in the audit logs section of the Signicat Dashboard.
# Account
When browsing the audit logs, only the events for your selected account are shown.
You can change which account you are viewing the audit logs for using the dropdown menu next your your organisation name in the top navigation bar.
# Adjusting the view
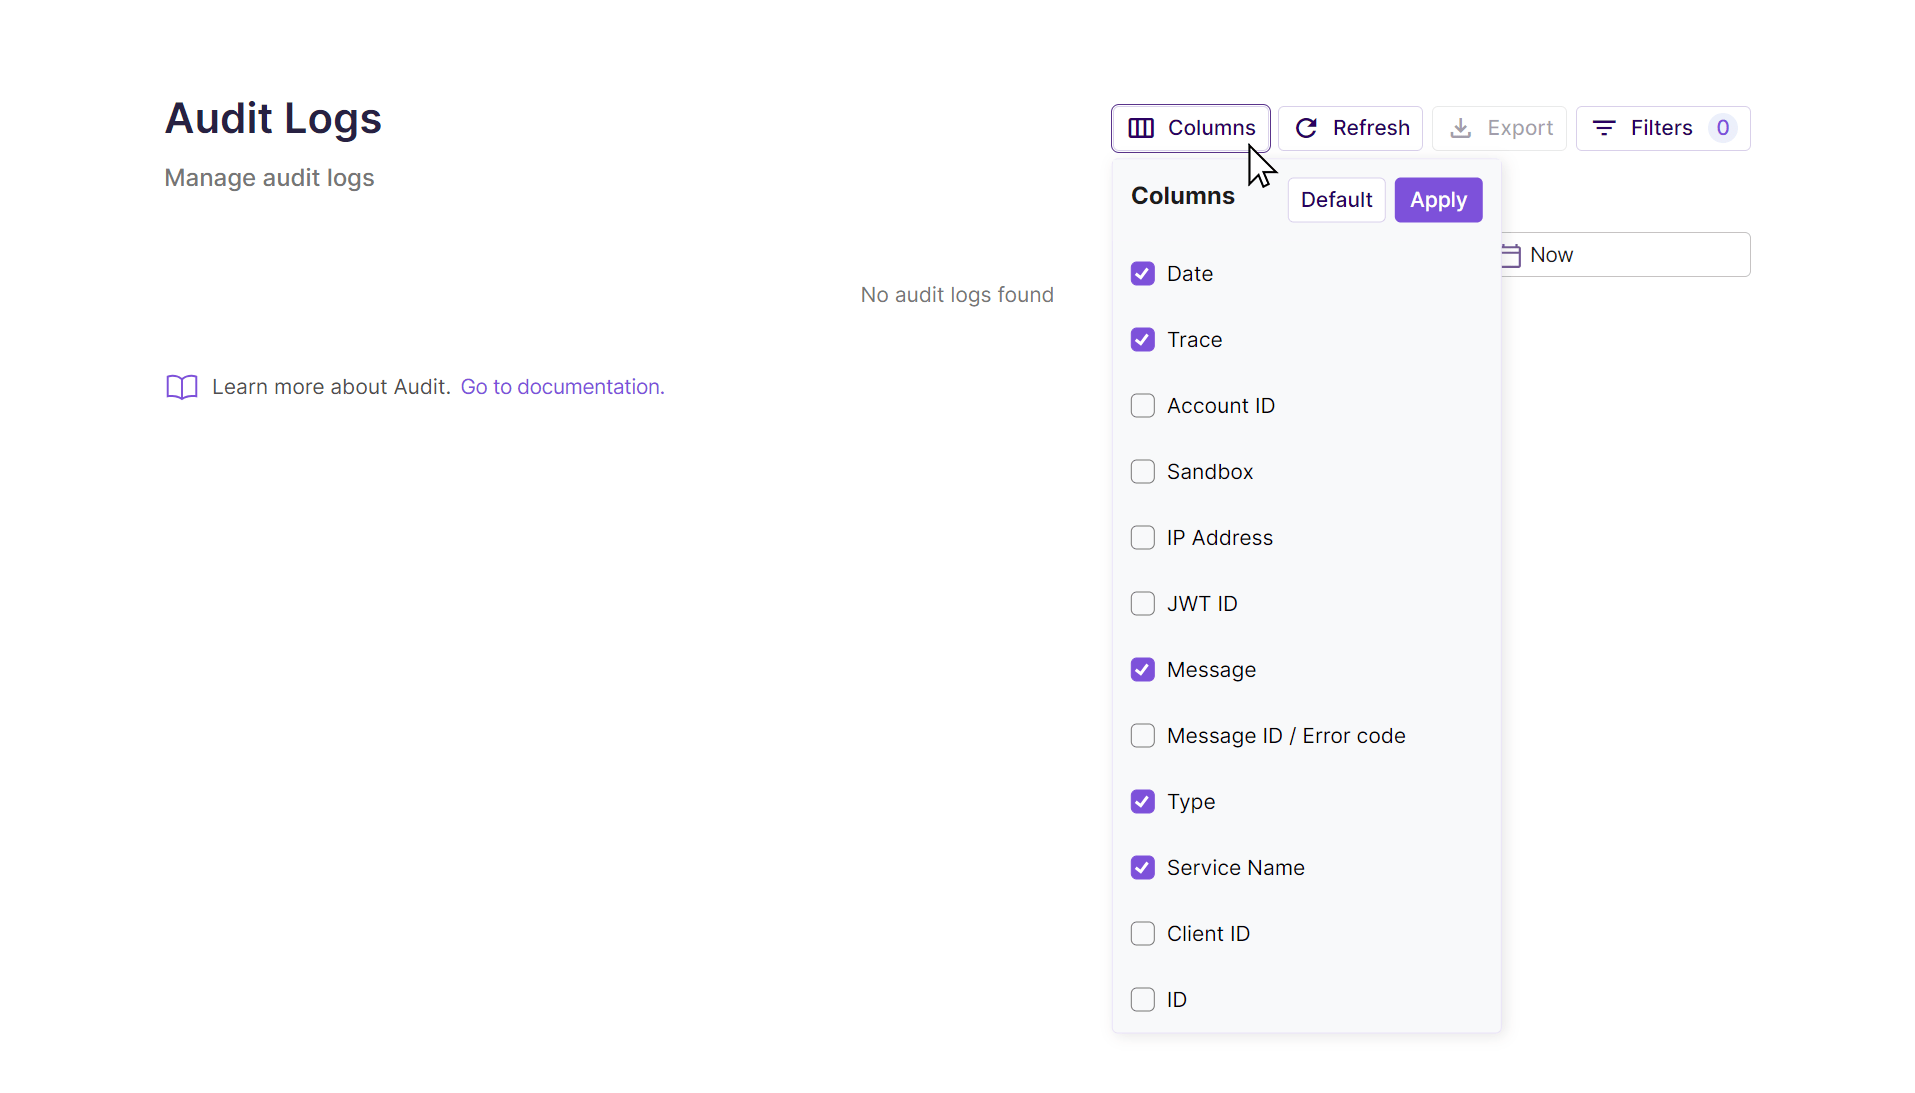
By default, there are five columns of data displayed for each event in the audit logs. You can modify which columns are shown in this table:
- Click the Columns button, to the top right of the audit logs table.
- Tick the boxes corresponding to the information you would like to see as a column.
- Click Apply.
# Reset to defaults
You can reset the audit logs table to the default settings if you wish to start again. To do this:
- Click the Columns button, to the top right of the audit logs table.
- Click the Default button.
- You have now reset the audit logs table to the default settings.
# Filtering data
By default, all audit logs for your account are shown. You can narrow down the results with filters, which can be applied in multiple ways:
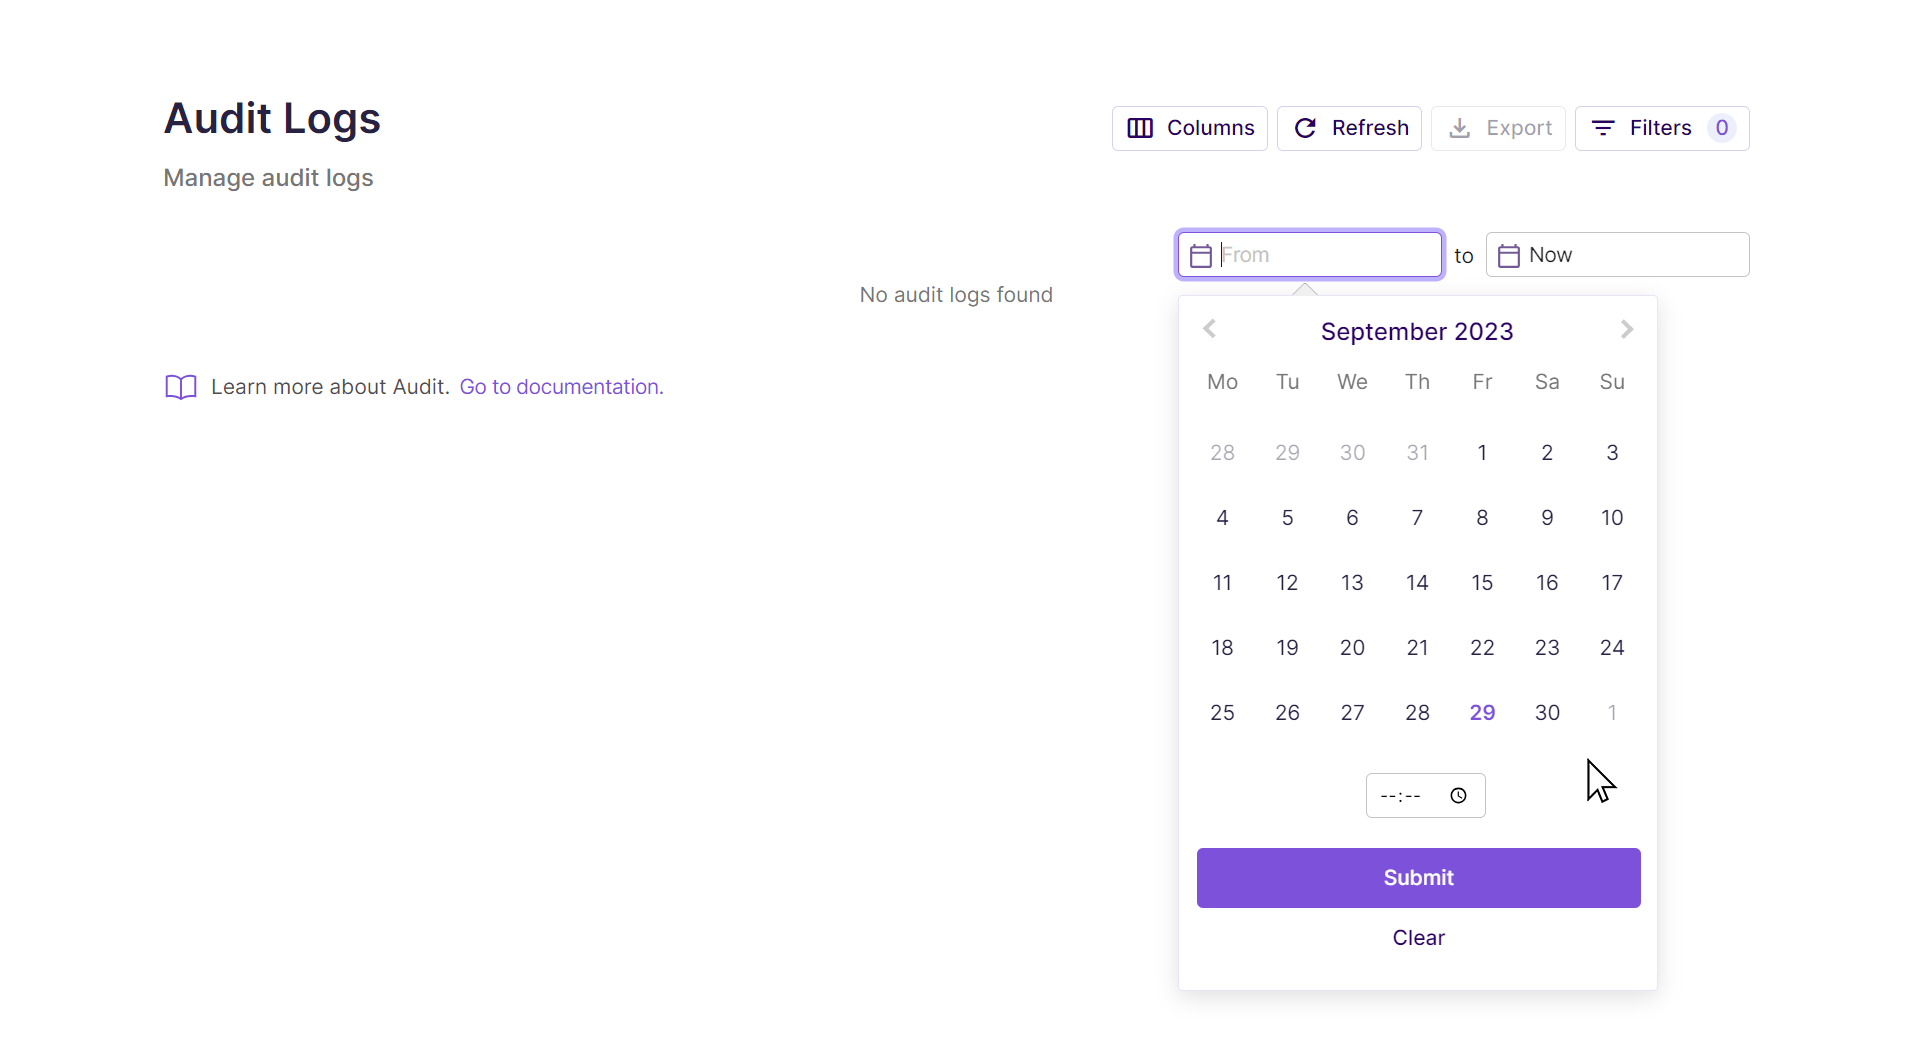
# Method 1: Applying filters for date
You can filter all queries by date, using the Date filter. To do this:
- Specify a range for your queries using the provided calendar and time fields.
- Click Apply.
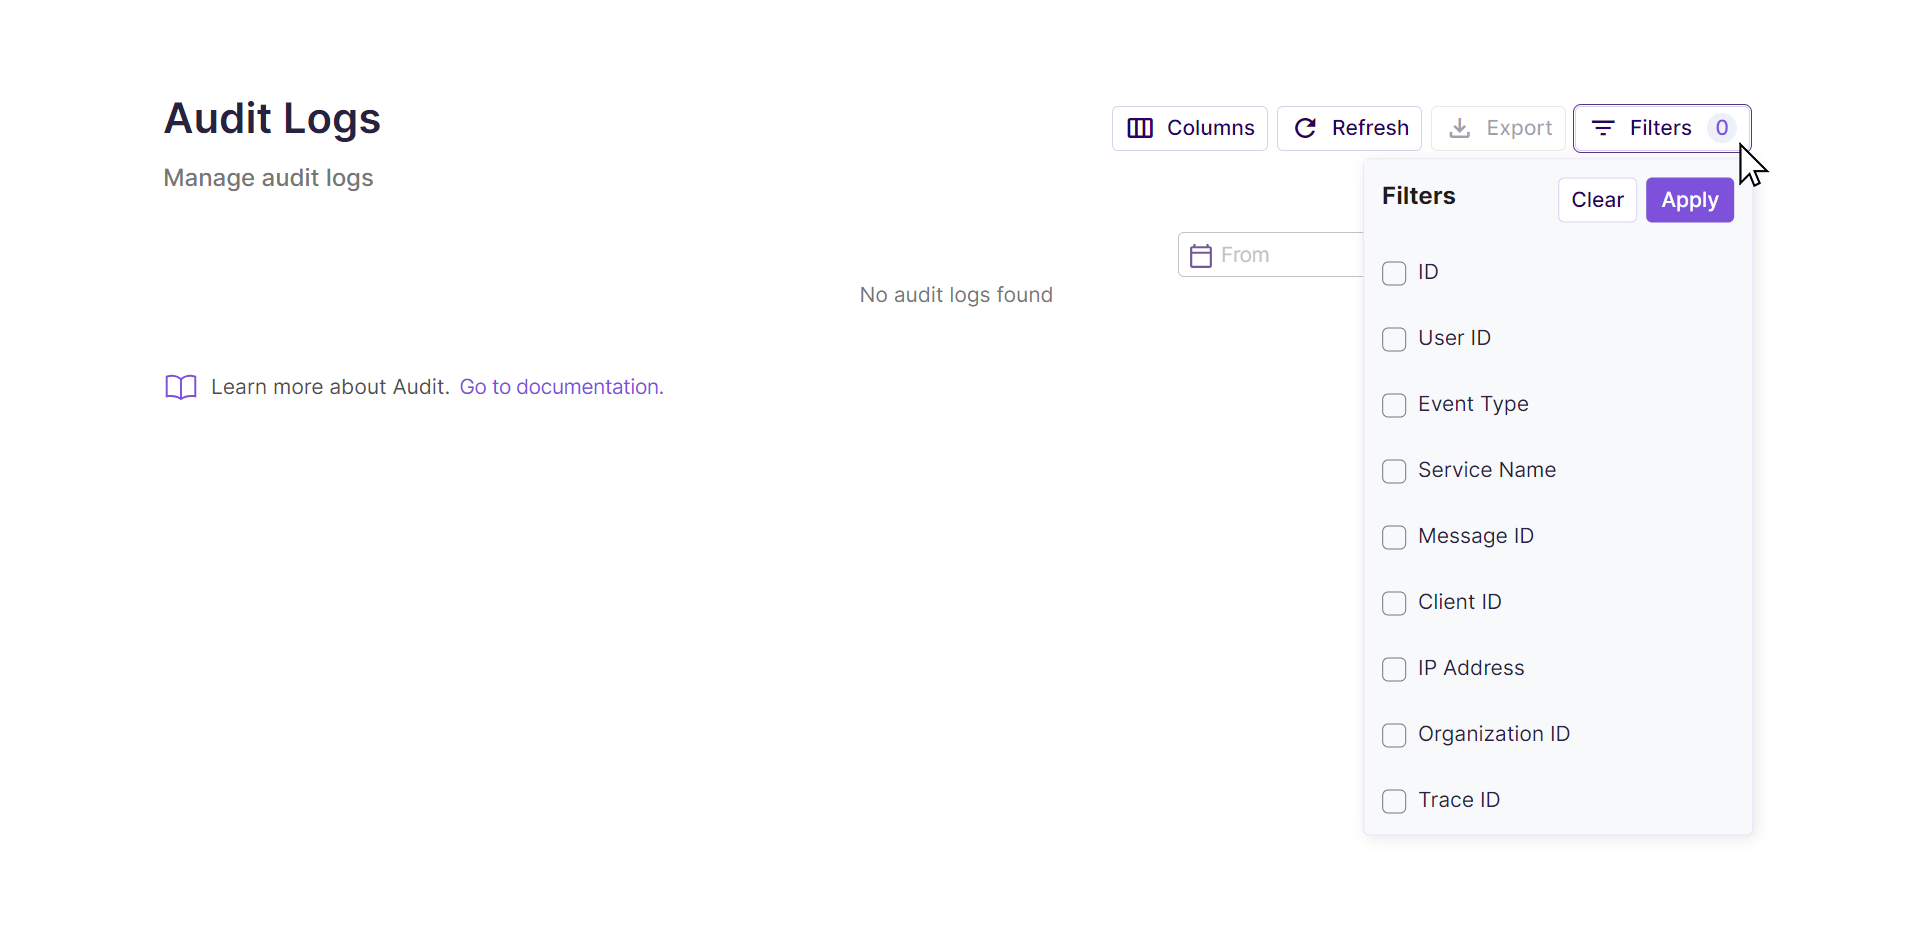
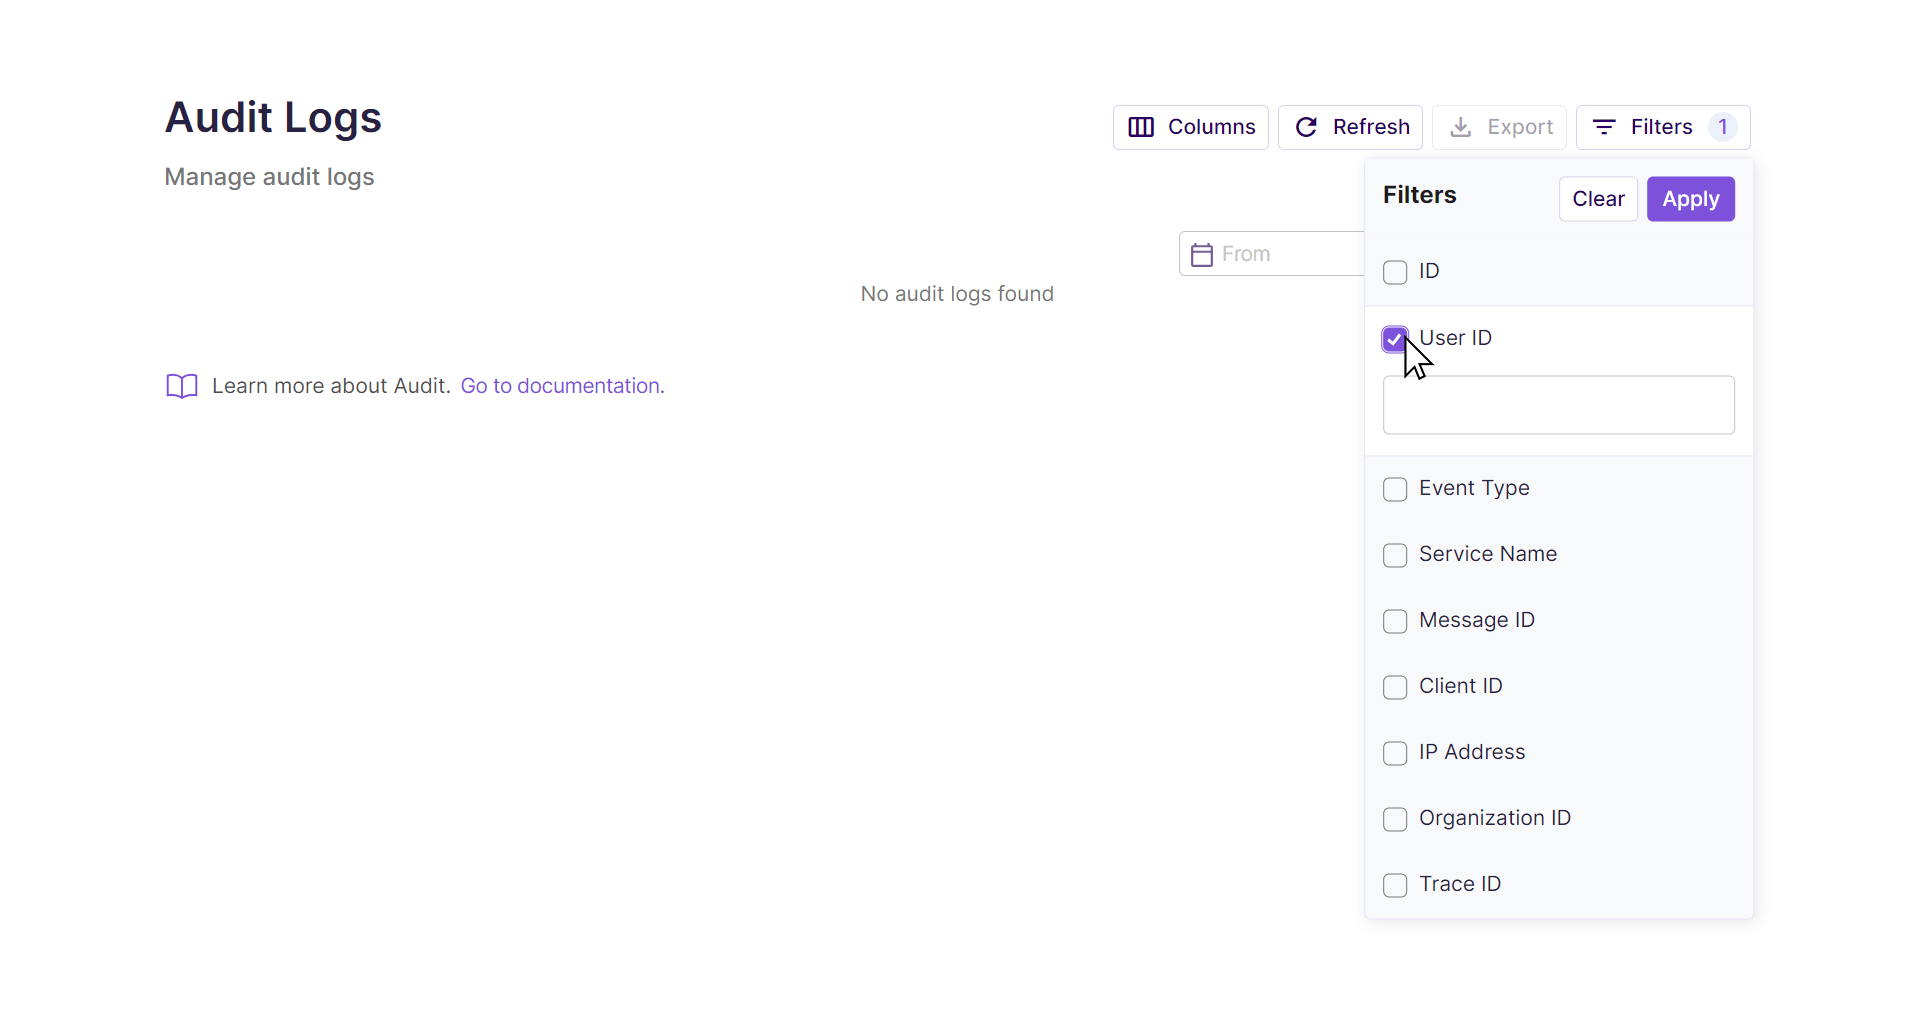
# Method 2: Applying filters manually
- Click the Filters button, to the top right of the audit logs table.
- Tick the boxes for the filters you would like to apply. Once you tick a box, you need to complete your selection with the required information presented in the user interface. This information will vary depending on if the filter type is by multi-select or text input.
- Click Apply.
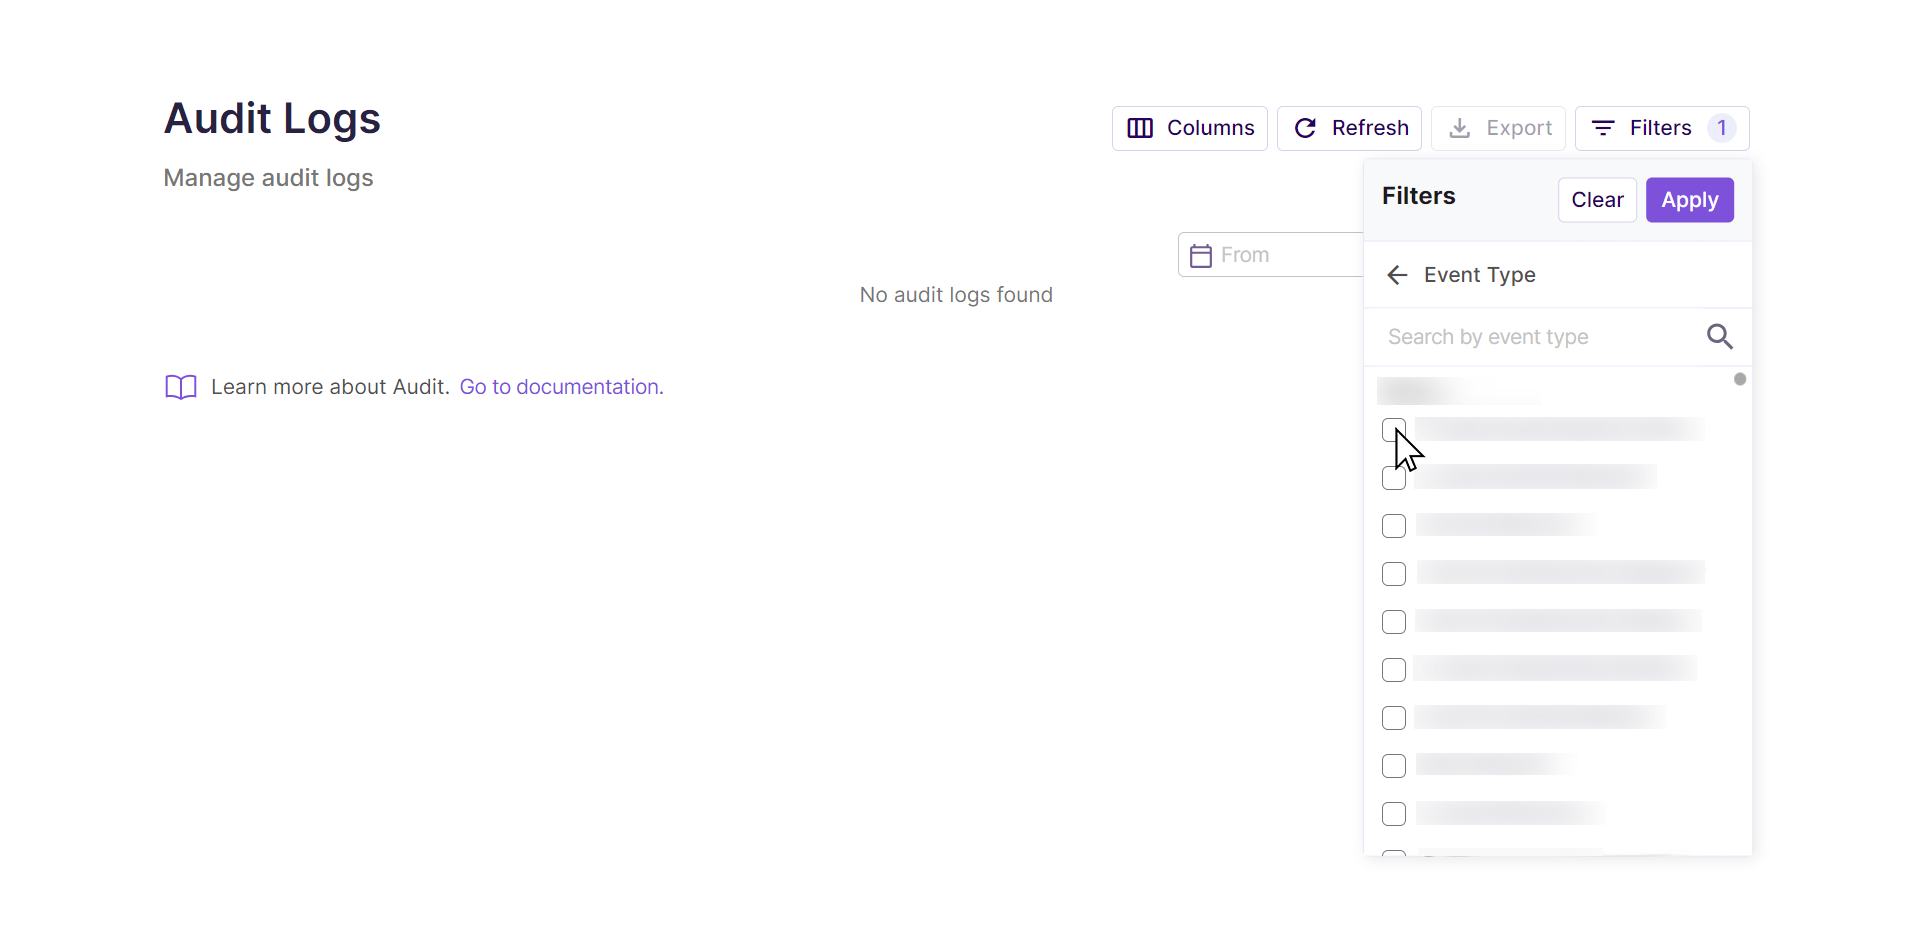
# Multi-select
Some of the filters such Event Type and Service Name allow you to select multiple values from a list. We show the events that match any of the values that you tick.
# Text input
Some of the filters such as User ID and IP Address allow you to input a value into the provided field. You can use this field to filter for a specific value.
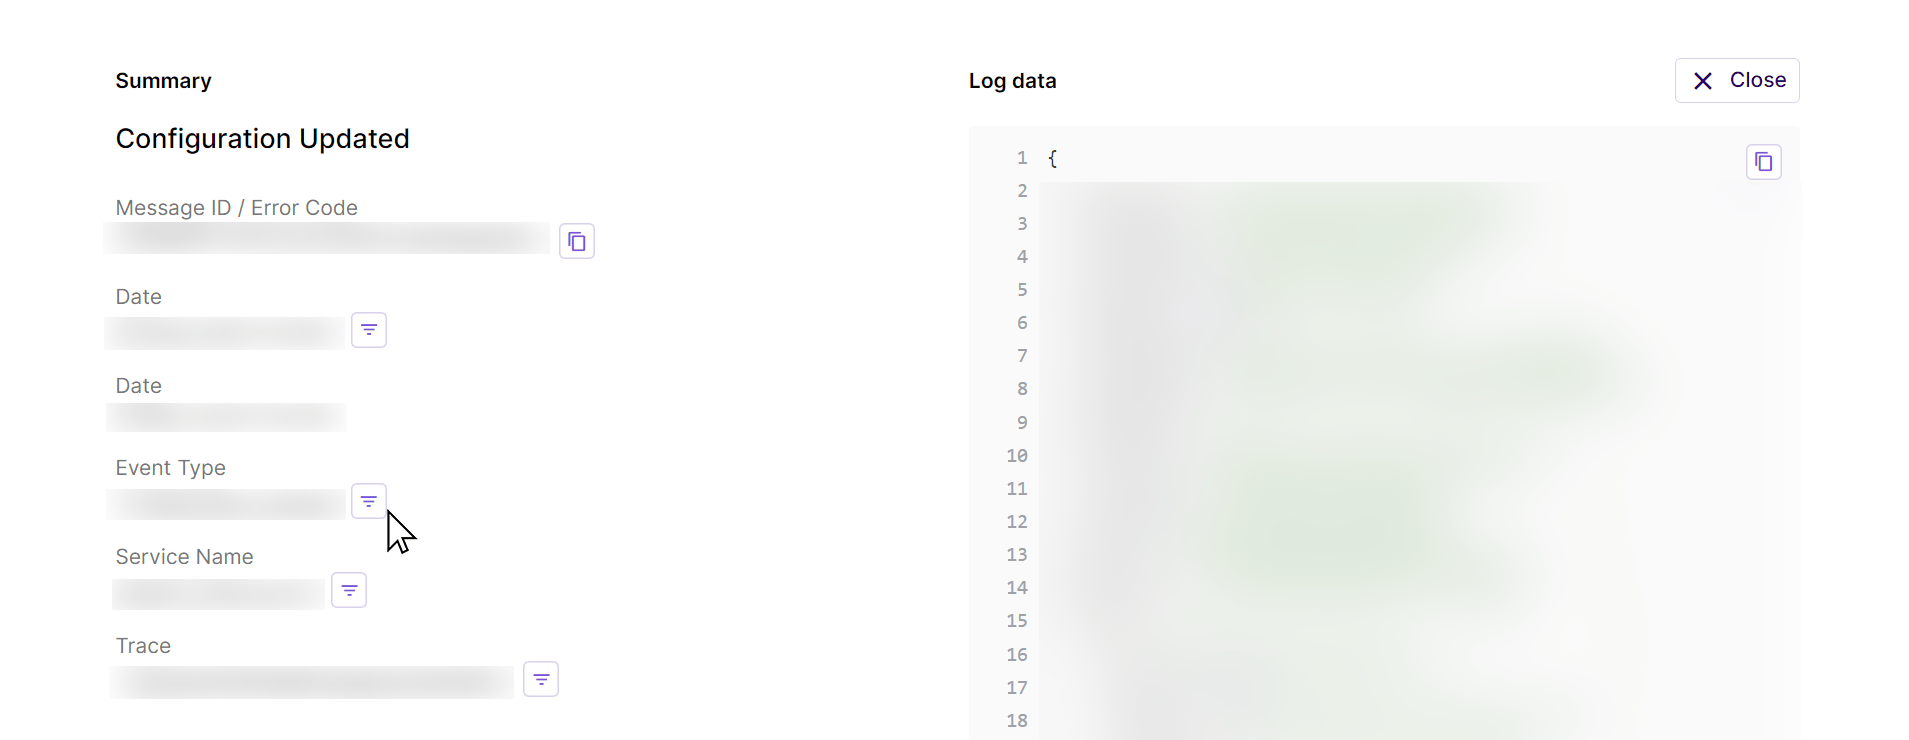
# Method 3: Applying filters using existing events
- Click on an event. This brings up the detailed view for this event.
- Under the Summary heading, locate the filter that you want to apply.
- Click the filter button to the right-hand side of that filter name.
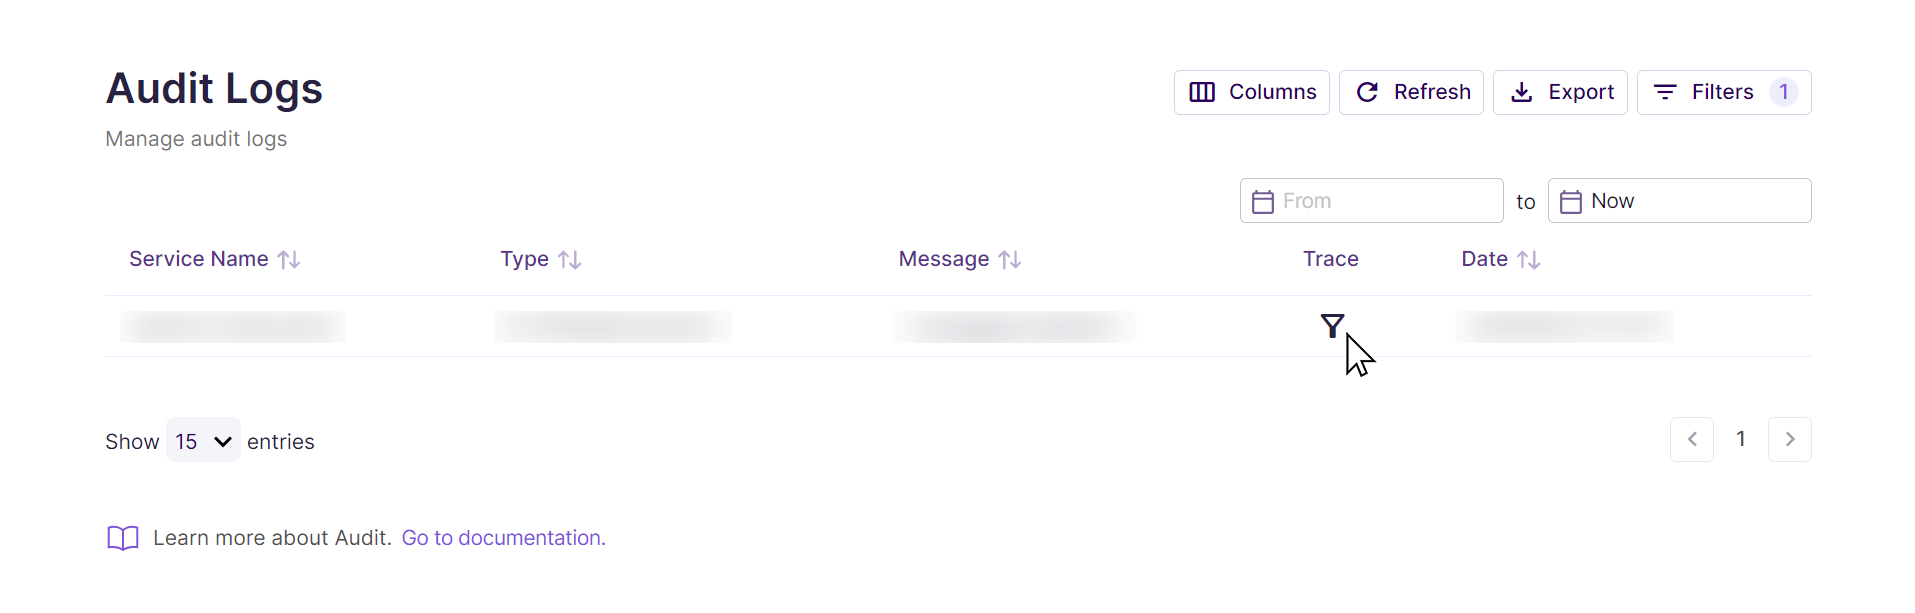
# Method 4: Applying filters from the audit log table
For some columns such as Trace, the filter tool is readily available from the event list. To apply the filter, click the filter button in the applicable column.
# Sharing the current filters
It is always possible to share the currently applied filters with others, such as your colleagues. To do this:
- Apply all desired filters.
- Copy the URL from your browser, and share this with the intended person.
# Clearing the current filters
You can clear all currently applied filters from the audit logs. To do this:
- Click the Filters button, to the top right of the audit logs table.
- Click the Clear button.
- You have now cleared all currently applied filters.
# Details view
You can click anywhere on a line in the event list to show more details about that event. This will take you to a new page:
- On the left-hand side, under the Summary heading, you are presented with key information about the audit log. You can add information as a filter from this view by clicking the corresponding filter button.
- On the right-hand side, under the Log data heading, you are presented with the event data in JSON format.
# Exporting data
We offer support for exporting the audit logs to a CSV file. To do this:
- Click the Export button, to the top right of the audit logs table.
- A CSV file containing all events that match the filters you have currently applied is downloaded.